Button CopyPathCircle CloseCircle Left ArrowArrow Down Icon GreyClosecirclecircleBurger
Listing # KV2022-5
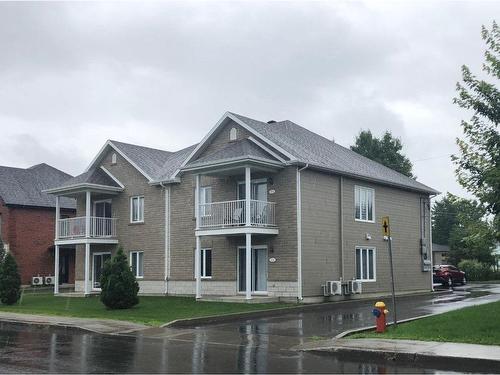
Investment For Sale In Drummondville,
$739,000
Drummondville, QC
Drummondville, QC
Drummondville, QC
Drummondville, QC
Drummondville, QC
Drummondville, QC
Drummondville, QC
Drummondville, QC
Drummondville, QC
Drummondville, QC
Drummondville, QC
Drummondville, QC
Drummondville, QC
Drummondville, QC
Drummondville, QC
Drummondville, QC
Drummondville, QC
Drummondville, QC
Drummondville, QC
Drummondville, QC
Drummondville, QC
Drummondville, QC
Drummondville, QC
Drummondville, QC
  • Advertising

Home Insurance - TD Insurance

Get a home insurance quote online for this $739,000 property in Drummondville

Advertisement
$739,000

Property Information:

Quadruplex 2013, bien situé a proximité Autoroute et services.Entretien minimum, balcons avant et patios arrières.Thermopompes. balayeuses centrale.Excellent potentiel d'optimisation a moyen et long terme.4 x 4 1/2 pces, électricité et chauffage au frais des locataires.Revenus: 44 844,00$, Détails locations: 1, 160 $ - 753 $ - 1071 $ - 753 $Visite sur promesse achat.

Property Features:

  • Bedrooms: 0
  • Bathrooms: 0+0
  • Basement:
  • Deck: Yes
  • Energy Efficient:
  • Fixer Upper:
  • Foreclosure:
  • Furnished:
  • Golf:
  • HOA:
  • Horse Property:
  • Master Bedroom on Main Floor:
  • Mature Community:
  • New Construction:
  • Pets Allowed:
  • Seller Financed:
  • Shortsale:

Climate Risk Data

About Climate Risk: Properties are at increased risk of damage from extreme weather due to climate change.
ClimateCheck provides detailed climate risk data for properties now and up to 30 years into the future.

Projected Heat Risk: High

32 hot days expected in 2050

Projected Storm Risk: Very High

15 storms expected in 2050

Projected Heat Risk: High

32 hot days expected in 2050

48/100

High

ClimateCheck®

Current data

This property experiences 7 hot days per year at around 30.2 degrees Celsius.

Projected data

Severe heat risk is expected to increase in this area. In 2050, it is projected that there will be 32 hot days at 33.6 degrees Celsius.

Projected Avg. Temperature

Past
30.2℃
2050
33.6℃

# Hot Days Per Year

Past
7
2050
32

About Heat Risk

Heat risk is the number of extreme heat days experienced each year looking at historical conditions (1980-2005) in your area and taking the 2% of the hottest days and projecting that into the future.

Projected Storm Risk:

15 storms expected in 2050

78/100

ClimateCheck®

Current data

This property experiences 12 significant 2-day storms per year, with about 363.4mm of precipitation per storm.

Projected data

Severe storms are expected to increase in this area. In 2050, it is projected that there will be 15 significant 2-day storms with 473.4mm of precipitation per year.

Precipitation Per Storm

Past
363.4mm
2050
473.4mm

48-Hour Storms Per Year

Past
12
2050
15

About Storm Risk

Storm risk is the number of high wind, wet or snowy events each year. Climate check looks at historical conditions (1980-2005) in your area, on the days with the top 1% of total precipitation in a year and projected to 2050.

Climate risk data is provided for informational purposes only on Royallepage.ca.
If you have questions or feedback about this data, get help at climatecheck.com.

Environmental Risks provided by ClimateCheck®

Royal LePage does not endorse nor guarantee this information. By providing this information, Royal LePage and its agents are not providing advice or guidance on climate risks. Royal LePage strongly recommends that consumers independently investigate the property’s climate risks to their own personal satisfaction.

Demographic Information

Life Stage

Older Couples

Employment Type

Blue Collar/Primary, Blue Collar/Service Sector

Average Household Income

$111,272.16

Average Number of Children

1.87

Household Population

Household Structure

Age of Population

Education

Education Level

No certificate/diploma/degree

17.9 %

High school certificate or equivalent

18.16 %

Apprenticeship trade certificate/diploma

22.68 %

College/non-university certificate

19.55 %

University certificate (below bachelor)

1.76 %

University Degree

19.95 %

Commuter

Travel To Work

By Car

95.64 %

By Public Transit

1.31 %

By Walking

1.63 %

By Bicycle

0.0 %

By Other Methods

1.42 %

Cultural Diversity

Knowledge of Official Language

Mother Tongue

Building Information

Building Type

Apartments (Low and High Rise)

15.93 %

Houses

84.07 %

Own Vs. Rent